Til_countplot
Published:
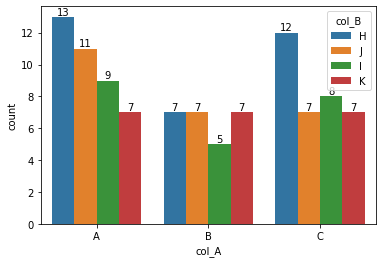
TIL: Making a seaborn count plot with hue and labels
It’s surprisingly hard to label bars in a seaborn countplot, especially if you use more than one column (e.g. when using hue). The function below does the labeling even when using two columns for indexing.
import pandas as pd
import matplotlib.pyplot as plt
import seaborn as sns
import numpy as np


def make_labelled_count_plot(
    data: pd.DataFrame, x_col: str, hue_col: str, **kwargs
) -> plt.Figure:
    """Creates a count plot from `data` and labels multi-indexed bars."""
    vals = data.groupby(x_col)[hue_col].value_counts()
    hue_vals = vals.index.unique(level=hue_col).values
    x_order = vals.index.unique(level=x_col).values

    fig, ax = plt.subplots(1, 1, **kwargs)
    sns.countplot(
        data=data, hue=hue_col, x=x_col, hue_order=hue_vals, order=x_order, ax=ax
    )

    for container, hue_val in zip(ax.containers, hue_vals):
        # take intersection because values could be missing
        safe_ordered = np.intersect1d(x_order, vals[:, hue_val].index)
        _ = ax.bar_label(container=container, labels=vals[:, hue_val][safe_ordered])
    return fig


data = pd.DataFrame(
    {
        "col_A": np.random.choice(["A", "B", "C"], 100),
        "col_B": np.random.choice(["H", "I", "J", "K"], 100),
    }
)
data.head()
fig = make_labelled_count_plot(data, x_col="col_A", hue_col="col_B")